What is the cosmic microwave background?
Scrollable formula. Use Left and Right arrow keys to reveal hidden content.
Scrollable table. Use Left and Right arrow keys to reveal additional columns.
Scrollable figure. Use Left and Right arrow keys to inspect hidden content.
https://blackhole.org/universe/cosmology/cosmic-microwave-background/
Microwave instruments detect a faint background of radiation across the sky. After accounting for foreground emission and our motion, its spectrum is extraordinarily close to the thermal radiation of a body at about 2.725 kelvin.
This cosmic microwave background, or CMB, is a relic of a hotter, denser universe. It tells us about conditions long before stars and galaxies formed. It is not a photograph of a first instant, and the colorful patchwork often used to display it is not what human eyes would see.
A thermal spectrum and a patchy sky answer different questions
Section titled “A thermal spectrum and a patchy sky answer different questions”A spectrum records how radiation is distributed across frequency or wavelength. A sky map records how a quantity changes with direction. These are different measurements of the same radiation.
An ideal blackbody has a characteristic thermal spectrum determined by its temperature. “Black” here refers to ideal absorption; it does not mean that the object emits no radiation. Hot blackbodies and cold ones have differently placed, differently bright spectra.
The COBE satellite’s FIRAS instrument compared the microwave sky with carefully calibrated thermal sources. Its analysis separated the sky-average CMB contribution from the dipole and Galactic emission. The measured spectrum closely follows a blackbody; NASA’s public product also supplies residuals and uncertainties, which show the departures rather than concealing them (NASA/GSFC LAMBDA, “FIRAS CMB Monopole Spectrum”).
The figure separates the two questions. The left panel is a calculated thermal curve. The right panel uses three invented directions to explain a temperature map; it contains no measured sky points.
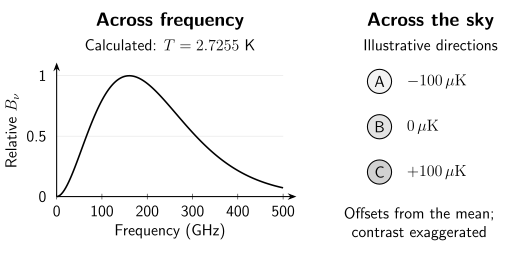
Frequency dependence and directional variation are distinct. The calculated spectrum is brightness per unit frequency, normalized to its peak at about 160 GHz, for 2.7255 K. The three directional offsets are illustrative, with contrast exaggerated; they are not an observed map. Neither panel contains measured data points or observational error bars.
| Comparison in the figure | What varies? | What the display means |
|---|---|---|
| Thermal curve | Observing frequency | Relative radiation brightness in each frequency interval |
| Directions A, B, and C | Position on the sky | Illustrative differences from the mean temperature |
The temperature used for the curve is a rounded input. Fixsen’s combined analysis reported K; the precision comes from calibration and comparison, not the number of digits a graph can print (Fixsen 2009, abstract and Table 2, PDF).
The early plasma scattered light repeatedly
Section titled “The early plasma scattered light repeatedly”Before atoms could remain neutral, much of the ordinary matter was an electrically charged mixture of nuclei and free electrons: a plasma. Photons scattered from free electrons frequently, making long, uninterrupted journeys difficult.
As expansion cooled the universe, electrons and nuclei combined into neutral atoms. This gradual process is called recombination. With far fewer free electrons, photons could travel much farther before scattering. Most CMB photons were already present in the radiation bath; the CMB is not mainly light newly emitted when hydrogen atoms formed (Carroll 2014, §8.7, p. 364).
The last-scattering surface is the region from which the photons reaching us now last scattered during that transition. It is not a material wall or the edge of space. Looking in different directions samples different parts of the early universe on our past light cone.
Some photons have interacted again since then, and later structures affect the signal. “Last scattering” identifies the dominant origin of the familiar primary CMB pattern; it does not mean that every arriving microwave photon has had an identical history.
Expansion cooled the radiation without erasing its thermal shape
Section titled “Expansion cooled the radiation without erasing its thermal shape”As freely traveling light follows the cosmic expansion, its wavelength grows and its energy decreases. A blackbody distribution keeps its thermal form while its temperature decreases in proportion to the inverse scale factor.
For illustration, multiply today’s 2.7255 K by 1,100. The result is about 2,998 K: a much warmer radiation bath. This calculation shows the direction and scale of the cooling. It does not independently measure the exact redshift or time of last scattering.
The observed thermal spectrum is an important part of the evidence for a hot past. It joins galaxy expansion and primordial-element measurements in the hot Big Bang explanation. Agreement among these tests is stronger than an attractive sky image alone.
Try the mathematics: temperature and a spectral peak
Preparation: inverse proportionality for cooling; exponential functions and the distinction between frequency and wavelength intervals for Planck’s law.
For freely propagating blackbody radiation after decoupling,
If the scale factor doubles, temperature halves. In the frequency spectrum, the peak frequency also halves; a corresponding wavelength scale doubles.
The curve in the figure uses Planck’s law,
is radiation brightness per unit frequency and solid angle; is frequency, is Planck’s constant, is Boltzmann’s constant, and is light speed. At the stated temperature, its peak is about 160.23 GHz, where one GHz is one billion cycles per second.
A spectrum per unit wavelength has a different shape because equal wavelength intervals do not correspond to equal frequency intervals. Simply replacing this peak frequency by does not locate the peak of the wavelength spectrum.
Tiny differences require careful foreground removal
Section titled “Tiny differences require careful foreground removal”The CMB is nearly uniform, but not perfectly uniform. Small directional variations preserve information about the early plasma and the perturbations from which later structure developed.
Our motion produces a prominent dipole: a broad warmer-looking direction opposite a cooler-looking one. Astronomers separate this from the smaller cosmological variations. Emission from Galactic dust and other sources must also be modeled. Observations at multiple frequencies help because these components have different spectral behavior (Planck Collaboration 2020, §§2.1 and 2.3–2.5).
The resulting maps often use strongly enhanced contrast. A patch that appears dark is not a region near absolute zero, and a bright patch is not a visible star. Researchers study patterns statistically, including their angular scales, and compare them with predictions. Inferring cosmic parameters then requires an explicit model; the map is evidence, not a printed list of the universe’s properties.
Predict what a contrast change can and cannot do
Section titled “Predict what a contrast change can and cannot do”A display uses black and white for temperature differences of minus and plus 100 microkelvin. A second display doubles the visual contrast of the same measurements. Has the physical temperature difference doubled? Would either display establish that the average spectrum is a blackbody?
Answer and transfer
No. Changing the display changes the representation, not the measured radiation. A 100-microkelvin offset is 0.0001 K, only about 0.0037 percent of a 2.7255 K mean.
Neither directional display alone establishes a blackbody spectrum. That requires comparing radiation across frequencies with a calibrated thermal prediction.
The same distinction applies to mapped-color astronomical images: inspect what the colors encode and what measurements support them. A stronger color does not automatically represent a larger physical change between two differently scaled images.
For educators
Preparation and objective. No prior microwave astronomy is needed. Students should distinguish a spectrum from a sky map and explain why display contrast does not change measured temperature.
Short activity, about 10 minutes. Label what varies in the two figure panels and solve the contrast-change question. Expected answer: frequency varies in the spectrum, direction in the map; doubling the displayed contrast does not double a measured temperature difference.
Longer extension, about 30 minutes. Have one group design a frequency graph and another a directional map. Exchange them and specify the measurements needed for each. Then calculate the effect of doubling the scale factor on temperature and the frequency-spectrum peak: both halve in the stated free-propagation model.
Misconception to discuss. “A dark CMB patch is near absolute zero.” A 100-microkelvin departure is only about 0.0037 percent of the mean. Also ask why neutral atoms forming and pre-existing photons last scattering are different processes; the CMB is not mainly newly emitted recombination-line light.
References
Section titled “References”- Carroll, S. M. (2014). Spacetime and Geometry: An Introduction to General Relativity. Pearson New International Edition, §§8.5 and 8.7. Author’s book page.
- Fixsen, D. J. (2009). “The Temperature of the Cosmic Microwave Background.” The Astrophysical Journal 707, 916–920. DOI; Open PDF.
- NASA/Goddard Space Flight Center, LAMBDA. FIRAS CMB Monopole Spectrum. COBE/FIRAS data product description. Spectrum documentation.
- Planck Collaboration, Akrami, Y., et al. (2020). “Planck 2018 Results. I. Overview and the Cosmological Legacy of Planck.” Astronomy & Astrophysics 641, A1. DOI; open manuscript.
Further reading
Section titled “Further reading”For an optional calculation of how the early plasma became transparent, read Recombination and Photon Decoupling. It distinguishes atomic formation from the distribution of photons’ last-scattering times. Preparation: thermodynamics, calculus, and the cosmological expansion rate.