What does a black-hole image actually show?
Scrollable formula. Use Left and Right arrow keys to reveal hidden content.
Scrollable table. Use Left and Right arrow keys to reveal additional columns.
Scrollable figure. Use Left and Right arrow keys to inspect hidden content.
https://blackhole.org/universe/black-holes/seeing-black-holes/
The familiar bright ring around a dark center is a map of radiation from a black hole’s surroundings. It is not light escaping from inside the event horizon, and it is not an orange surface photographed by a nearby spacecraft.
To understand the image, follow three questions: What did the instruments measure? Which image features do those measurements support? What physical model explains them? An observation of M87* introduces the image below. For the detailed reconstruction discussion and numerical ring measurement, we use the Event Horizon Telescope’s 2017 observations of a different source, Sagittarius A*, whose first images were released in 2022.
Radio telescopes measure the surroundings
Section titled “Radio telescopes measure the surroundings”Look at the uneven bright ring and dim centre in this image of M87*, the compact source associated with the black hole in the galaxy M87. The EHT reconstructed this radio-brightness map from observations made in 2017 and released it in 2019. Orange represents the strength of invisible millimetre-wave emission, not a measurement of orange-coloured fire. ESO/EHT Collaboration 2019, “First Image of a Black Hole,” image description
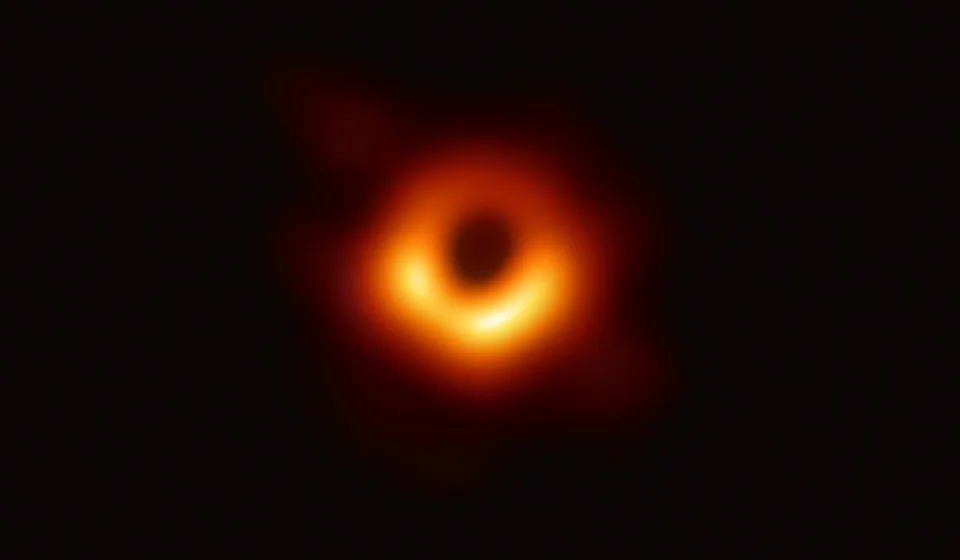
The EHT reconstructed this asymmetric ring around M87* from 1.3 mm radio measurements. Orange shows radio brightness; the dark centre is associated with the black-hole shadow.
Credit: EHT Collaboration. Image source · Reuse terms
About this observation
Event Horizon Telescope, 1.3 mm radio observations collected in April 2017, image released 10 April 2019. Image reconstructed from interferometric measurements. Orange/yellow display radio brightness; not visible-light colours, a solid surface or the event horizon itself.
Resized for this page; displayed images retain the source's colors and full frame. These images do not share a common physical scale.
The pattern supports the interpretation of emitting material around a black hole, with strong gravity altering the paths of its light. The image does not trace a solid surface, directly mark the horizon, or uniquely locate every parcel of plasma. Keep the object names separate: the numerical example that follows concerns Sgr A* in our own galaxy, not the displayed M87* image.
Sagittarius A*, usually shortened to Sgr A*, is the compact source at the center of the Milky Way associated with its supermassive black hole. Hot, magnetized plasma—gas containing freely moving charged particles—near the hole emits radio radiation. Some of that radiation reaches us. The event horizon is the boundary beyond which signals cannot escape to distant observers; it is not the glowing material (EHT, FAQ, “How do you observe something that does not radiate?”).
In April 2017, the Event Horizon Telescope, or EHT, observed Sgr A* with eight telescopes operating at a wavelength of about 1.3 millimeters. The stations recorded signals that were later correlated in pairs: researchers compared the recorded waves while accounting for their different arrival times. Calibration corrected instrumental and atmospheric effects (EHT Collaboration 2022, Paper I, §3, PDF).
The result of each pairwise comparison is called a visibility. It constrains patterns in the sky’s brightness at a particular angular scale and orientation. It is not a little photograph taken by that telescope pair. Many measurements, taken with different telescope separations and orientations, are needed to recover an image.
An Earth-sized baseline reveals tiny angular detail
Section titled “An Earth-sized baseline reveals tiny angular detail”The separation between two observing sites is a baseline. Longer projected baselines probe smaller angular structures. Shorter observing wavelengths also provide finer angular detail. This is the central idea of very-long-baseline interferometry, or VLBI (EHT, FAQ, explanation of radio resolving power).
An array spread across Earth can therefore resolve much finer structure than any one of its dishes. Its collecting area is still the area of the actual telescopes, not the area of an Earth-sized filled mirror. Many baselines and enough sensitivity are needed to measure a useful range of structures.
Estimate the angular scale
Preparation: ratios, powers of ten, and conversion between radians and angular units.
For observing wavelength and projected baseline length , a characteristic angular scale in radians is
Take an illustrative and . Then
One microarcsecond, written , is one millionth of an arcsecond; an arcsecond is of a degree. The measured emission ring in this example is roughly 52 microarcseconds across, so Earth-sized baselines at millimeter wavelengths reach the relevant angular scale.
This estimate is not a complete resolution model or an uncertainty on the ring diameter. The number and directions of baselines, noise, calibration, and reconstruction method all matter. Holding wavelength fixed while halving the baseline doubles this characteristic angular scale, giving coarser detail.
Sparse measurements require image reconstruction
Section titled “Sparse measurements require image reconstruction”The EHT does not cover Earth with telescopes. Many possible brightness patterns therefore remain unmeasured. Earth rotates during an observing run, changing the projected baselines and adding information, but it does not fill every gap.
An image reconstruction searches for a brightness map consistent with the measured visibilities and their uncertainties, together with stated assumptions about plausible images. Sgr A* adds two difficulties: its emission varies during a night’s observations, and intervening material scatters the radio waves. Both effects must be included in the analysis (EHT Collaboration 2022, Paper III, §§II–IV, author text).
The diagram distinguishes measured signals, reconstructed brightness, and physical interpretation. Its dashed branch represents a check with known test scenes; it is not extra observational data.
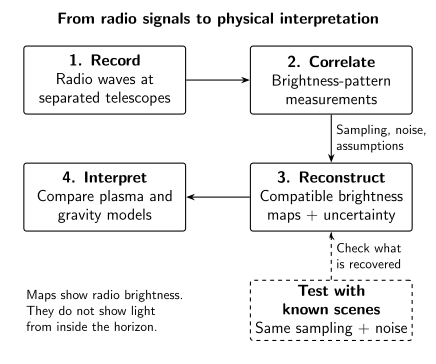
Radio imaging connects observation to inference through several testable steps. A reconstructed brightness map is constrained by measurements and assumptions; explaining it requires a physical model. This schematic contains no observed EHT image or visibility data. Tests with synthetic scenes check recovery under specified sampling and noise.
Researchers tested several reconstruction approaches and varied their assumptions. They also generated synthetic observations from known scenes—including scenes without rings—and asked whether the methods recovered the input. Such tests help reveal features that an algorithm or observing pattern could manufacture. They do not guarantee that every feature of an unknown real source is recovered (EHT Collaboration 2022, Paper III, §§VI.2.2 and VI.4, author text).
The ring’s broad size is more robust than the exact position of its brightest patches. Different compatible reconstructions can disagree on those details. A set of such images is not automatically a sequence of frames showing matter moving around the hole.
The bright ring, shadow, and horizon are different
Section titled “The bright ring, shadow, and horizon are different”The EHT’s 2022 analysis reported an emission-ring diameter of , quoted as a 68% credible interval. This is a result of the specified measurement and modeling analysis. It is not the diameter of the event horizon (EHT Collaboration 2022, Paper I, §5 and Table 1, PDF).
The bright region comes from emitting plasma, with the observed appearance altered by strong gravitational bending of light and the plasma’s motion. The shadow describes a dark region associated with directions whose light paths, traced backward from the observer, lead toward the hole rather than a distant background. Its apparent size is affected by gravitational lensing; it is larger than a simple projected horizon disk (NASA, “Black Hole Anatomy,” “Event Horizon Shadow”).
In real images, the depth and shape of the central dim region also depend on where the emitting and absorbing plasma lies, as well as observational resolution. Researchers compare the data with models of that plasma and of spacetime. The match, together with independent evidence such as stellar orbits, supports the black-hole interpretation. An image alone does not uniquely determine every property of the hole or its surrounding gas.
For a simpler example of how bent paths change apparent images, begin with gravitational lensing by a foreground mass. Its weak-field approximation is useful for learning the geometry, but does not calculate a black-hole shadow.
Display colors add another layer. The orange palette used in familiar EHT images encodes radio brightness; human eyes cannot see 1.3-millimeter radiation. Paper I’s Figure 3 states what its color scale represents. Choosing a different palette would not move the measured ring or change its angular diameter.
Decide what a changing bright patch means
Section titled “Decide what a changing bright patch means”Two reconstructions of the same observing period show rings of similar diameter, but their brightest patches lie in different places. A headline claims that comparing them reveals the precise motion of a clump of gas. Does that follow?
Answer and the missing evidence
No. They may be different images compatible with the same incomplete measurements, not observations of successive moments. Agreement about the broad ring does not make every bright patch equally certain.
To claim a movie, we would need time-resolved information and a reconstruction method shown to recover changes at that cadence, while accounting for sampling, noise, scattering, and assumptions about how the image changes. Even a moving brightness pattern need not track one permanent clump of matter.
The useful question is therefore specific: which feature is supported, on which angular and time scales, under which assumptions? “The image is reconstructed” does not make it arbitrary, and “several methods show a ring” does not establish every fine detail.
For educators
Preparation and objective. No prior interferometry is needed. Students should distinguish measured radio correlations, a reconstructed brightness map, and an interpretation involving hot plasma and gravity.
Short activity, about 10 minutes. Label those three stages in the figure and solve the changing-bright-patch question. Expected answer: different reconstructions of the same period are not successive movie frames.
Longer extension, about 30 minutes. Give groups the same incomplete clues to an unknown drawing, ask for compatible drawings, and identify shared features. Reveal a known test drawing to discuss recovery tests. Then calculate the effect of halving an interferometer baseline: at fixed wavelength, its characteristic angular scale doubles. The drawing analogy is limited; actual EHT measurements constrain mathematical brightness patterns rather than arbitrary verbal clues.
Misconception to discuss. “Reconstructed means invented.” Measurements constrain a family of images, and tests assess which features survive changes in method. Conversely, a robust ring diameter does not make every bright patch equally certain. Require one piece of evidence for each claimed feature.
Continue with Black Holes: Start Here for the other evidence channels, or how astronomical images use color to separate wavelength from display choice.
References
Section titled “References”- ESO/Event Horizon Telescope Collaboration (2019). First Image of a Black Hole. Image eso1907a, 10 April 2019, from 2017 observations of M87*. Observation, credit and reuse terms.
- Event Horizon Telescope. Frequently Asked Questions. Explanations of emission from black-hole surroundings and radio angular resolution. EHT FAQ.
- Event Horizon Telescope Collaboration (2022). “First Sagittarius A* Event Horizon Telescope Results. I. The Shadow of the Supermassive Black Hole in the Center of the Milky Way.” The Astrophysical Journal Letters 930, L12. DOI; Open PDF, author version. Citations use the author version’s sections, Figure 3, and Table 1.
- Event Horizon Telescope Collaboration (2022). “First Sagittarius A* Event Horizon Telescope Results. III. Imaging of the Galactic Center Supermassive Black Hole.” The Astrophysical Journal Letters 930, L14. DOI; open author text. Roman section numbers refer to this author version.
- NASA. Black Hole Anatomy. Section “Event Horizon Shadow.” Anatomy explanation.
Further reading
Section titled “Further reading”For an optional derivation of what an interferometer measures and how an image is constrained, read Very-Long-Baseline Interferometry. Preparation: wave optics, complex numbers, Fourier transforms, and basic statistical inference.