How do we map the Milky Way from inside it?
Scrollable formula. Use Left and Right arrow keys to reveal hidden content.
Scrollable table. Use Left and Right arrow keys to reveal additional columns.
Scrollable figure. Use Left and Right arrow keys to inspect hidden content.
https://blackhole.org/universe/galaxies/milky-way/
Under a dark sky, the Milky Way appears as a broad, uneven band of light. It is our view through part of a galaxy: a system of stars, gas, dust, and dark matter held together by gravity. The Sun belongs to it.
We cannot step outside our galaxy to take its portrait. Instead, astronomers combine measurements made from within it. The challenge resembles mapping a city from its streets: directions help, but a convincing map also needs distances, information about what blocks the view, and ways to check the reconstruction.
The galactic disk makes a band across the sky
Section titled “The galactic disk makes a band across the sky”Much of the Milky Way’s starlight comes from a flattened disk. Looking along that disk, we look through many overlapping stellar populations. Looking away from its plane, we generally encounter less disk material. Many individual stars are too faint for our unaided eyes to separate, so their combined light forms a band.
The disk is not the whole galaxy. There is a central bulge, a bar crossing the inner region, and a sparse stellar halo extending around the disk. These components overlap; they are not separate shells with sharp boundaries. The stellar halo also differs from the much more extensive distribution of dark matter inferred through gravity (Bland-Hawthorn and Gerhard 2016, §§4–6).
In this diagram, start at the Sun and compare the two viewing directions in the right panel. Neither panel is an outside photograph.
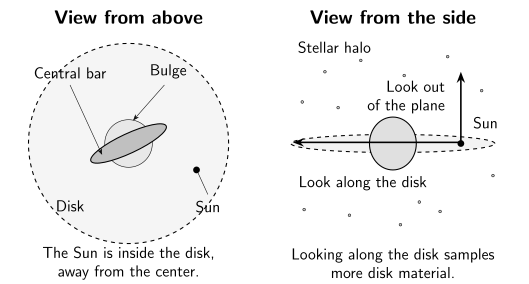
Our position inside a flattened disk helps explain the Milky Way’s appearance as a sky band. These are schematic views of inferred structure, not photographs or a precise spiral-arm map. Thicknesses and component extents are not to scale; the sparse halo symbols represent stars, not dark matter.
A direction becomes a place only when we add distance
Section titled “A direction becomes a place only when we add distance”Two stars can lie close together on the sky while being far apart in space. A direction tells us where to point a telescope, not how far its light has traveled.
For many stars, astronomers measure parallax: the small apparent change in direction as the observer’s location changes during Earth’s orbit. Repeated position measurements also reveal proper motion, the star’s changing direction over time. Spectra provide a third ingredient: motion toward or away from us through the Doppler shift of spectral lines.
The Gaia mission brings these measurements together. Its third data release includes positions, parallaxes, proper motions, and additional spectroscopic information for selected sources. They do different jobs; no single measurement supplies a complete three-dimensional position and velocity (Gaia Collaboration 2023, §§3 and 5, PDF).
| Measurement | What it contributes | What it does not supply alone |
|---|---|---|
| Direction on the sky | A line of sight | Distance along that line |
| Parallax | Geometric distance information | A complete orbit |
| Proper motion | Angular motion across the sky | Transverse speed without distance |
| Spectral-line shift | Motion along the line of sight | Motion across the sky |
A measured parallax also has uncertainty. If its uncertainty is large, simply taking its reciprocal can give a misleading distance estimate. Good reconstructions carry the measurement uncertainties and selection effects into the final map.
Dust hides part of the view
Section titled “Dust hides part of the view”The dark lanes across the Milky Way do not necessarily mark empty regions. Interstellar dust absorbs and scatters visible light, hiding some stars and changing the colors of those we can still detect.
Longer-wavelength observations help. Infrared light generally penetrates dust more effectively than visible light, while radio measurements can trace gas that is difficult to map through starlight alone. These views are complementary: an infrared star map and a radio gas map need not show identical structures.
Infrared star counts helped reveal the central bar, but interpretation still requires models of dust and the overlapping stellar populations (Bland-Hawthorn and Gerhard 2016, §4.3). More detected objects do not automatically mean more stars are physically present there; the telescope might simply see more easily in that direction. Gaia’s published caveats similarly distinguish measured quantities from inferred distances and extinction (Gaia Collaboration 2023, §9.2, PDF).
Moving stars give the map a physical scale
Section titled “Moving stars give the map a physical scale”The Sun is roughly eight kiloparsecs from the galactic center. One kiloparsec is a thousand parsecs, or about 3,260 light-years, so the separation is roughly 26,000 light-years.
One precise method uses the orbit of the star S2 around the central compact object Sagittarius A*, usually written Sgr A*. Angular positions trace the orbit on the sky; spectroscopy measures motion in physical units. Fitting both connects apparent size with physical size. In a 2019 study, the GRAVITY Collaboration inferred a distance of 8,178 parsecs, with separate statistical and systematic uncertainties (GRAVITY Collaboration 2019, §§4.1–4.2, PDF).
This measurement helps place us within the galaxy. It does not mean that every galactic orbit is controlled mainly by the central black hole. Farther out, stars, gas, and the extended gravitating mass all matter. That broader question belongs to galaxy rotation and dark matter.
Try the mathematics: one trip around the galaxy
Preparation: circle circumference, dividing distance by speed, and unit conversion.
For an illustrative circular orbit of radius kpc and speed km/s, the period is circumference divided by speed:
Using km gives about seconds, or 214 million years.
These are chosen round numbers for a circular model, not a precise reconstruction of the Sun’s orbit. Holding speed fixed, doubling the radius doubles the period. Holding radius fixed, doubling the speed halves it.
Test whether a dark patch is an empty patch
Section titled “Test whether a dark patch is an empty patch”An optical image shows few stars in one part of the galactic band. An infrared image of the same direction reveals many more. Which explanation gains support: a region with almost no stars, or obscuration by dust? What further comparison would make the conclusion stronger?
Answer and transfer
Dust obscuration gains support because the two wavelengths see through the region differently. Compare matched areas with known instrument sensitivity, and test whether stellar colors or other dust measurements support the same interpretation.
The extra infrared sources are not automatically all at the same distance. Add distance information before turning the apparent concentration into a three-dimensional structure. The general lesson applies to any astronomical map: absence from a detector’s image is not automatically physical absence.
For educators
Preparation and objective. No previous galaxy model is required. Students should use our position inside the disk to explain the sky band and distinguish direction, distance, and obscuration.
Short activity, about 10 minutes. Mark the Sun and trace long and short sightlines through the diagram’s disk. Expected answer: a sightline along the disk encounters more disk material than one away from the plane; neither drawing is an outside photograph.
Longer extension, about 30 minutes. Groups design two hypothetical star-count maps of the same area, one optical and one infrared, and explain a dark optical patch. Require a sensitivity comparison and a distance measurement before claiming a three-dimensional structure. With a calculator, reproduce the illustrative circular period of about 214 million years.
Misconception to discuss. “Few stars in an image means few stars in that region.” Dust and detection limits can suppress the count. The explained optical–infrared task above shows what would support obscuration and why extra sources still need distances.
References
Section titled “References”- Bland-Hawthorn, J., and Gerhard, O. (2016). “The Galaxy in Context: Structural, Kinematic, and Integrated Properties.” Annual Review of Astronomy and Astrophysics 54, 529–596. DOI; open manuscript.
- Gaia Collaboration, Vallenari, A., et al. (2023). “Gaia Data Release 3: Summary of the Content and Survey Properties.” Astronomy & Astrophysics 674, A1. DOI; Open PDF.
- GRAVITY Collaboration, Abuter, R., et al. (2019). “A Geometric Distance Measurement to the Galactic Center Black Hole with 0.3% Uncertainty.” Astronomy & Astrophysics 625, L10. DOI; Open PDF.