Are the colours in space pictures real?
Scrollable formula. Use Left and Right arrow keys to reveal hidden content.
Scrollable table. Use Left and Right arrow keys to reveal additional columns.
Scrollable figure. Use Left and Right arrow keys to inspect hidden content.
https://blackhole.org/universe/observing/astronomical-images/
An astronomical picture can show real measurements in colours that no human eye would see directly. A detector records signals through selected wavelength bands; image makers turn those measurements into a display. To understand the picture, ask which light was measured, how it was processed, and what the displayed colours represent.
For more context, Reading starlight explains wavelengths and spectral features. Telescopes distinguishes collecting light from resolving detail.
Predict first. A caption says that infrared light is displayed in red. Does that mean the object would look red if you could stand beside it?
A camera measures through filters
Section titled “A camera measures through filters”A telescope image is a grid of measured signals. Each pixel samples a small region of the image. A filter selects a range of wavelengths reaching a detector. Some filters admit a broad band; others isolate a much narrower region around a spectral feature. The detector’s sensitivity also varies with wavelength, so a filter name is only part of the instrument description.
Many astronomical images begin as separate grayscale exposures through different filters. Combining them into a colour picture requires choosing how each exposure contributes to the display’s red, green, and blue channels. Measurements outside visible light must also be translated into something a screen can show. NASA n.d., “Hubble FAQs,” § How are images taken by Hubble processed? Are the colors real?
Our constructed example below keeps three measured levels fixed and changes only their display assignments. Read the numbers as well as looking at the swatches: two different colours can encode exactly the same three values.
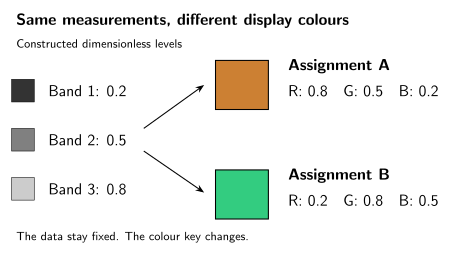
Colour needs a key. Both displays encode the same three constructed levels; only the channel assignment changes. The dimensionless levels and swatches are a teaching example, not an observation or a physical model of a star’s colour. The numerical channel labels make the comparison readable without distinguishing the colours.
| Display assignment | Red channel | Green channel | Blue channel |
|---|---|---|---|
| A | Band 3: 0.8 | Band 2: 0.5 | Band 1: 0.2 |
| B | Band 1: 0.2 | Band 3: 0.8 | Band 2: 0.5 |
Without the key, saying that one version is “more orange” tells us about the display but does not identify a new property of the source. With the key, the picture becomes a way to compare the spatial patterns measured in different bands.
Read one real image’s colour key
Section titled “Read one real image’s colour key”NASA’s 2015 paired Hubble views of the Pillars of Creation, § Color Info provide a concrete example. Compare the dark columns and the stars visible around and through them. These source releases use different fields of view, so they are not a pixel-aligned comparison or two frames of a movie.
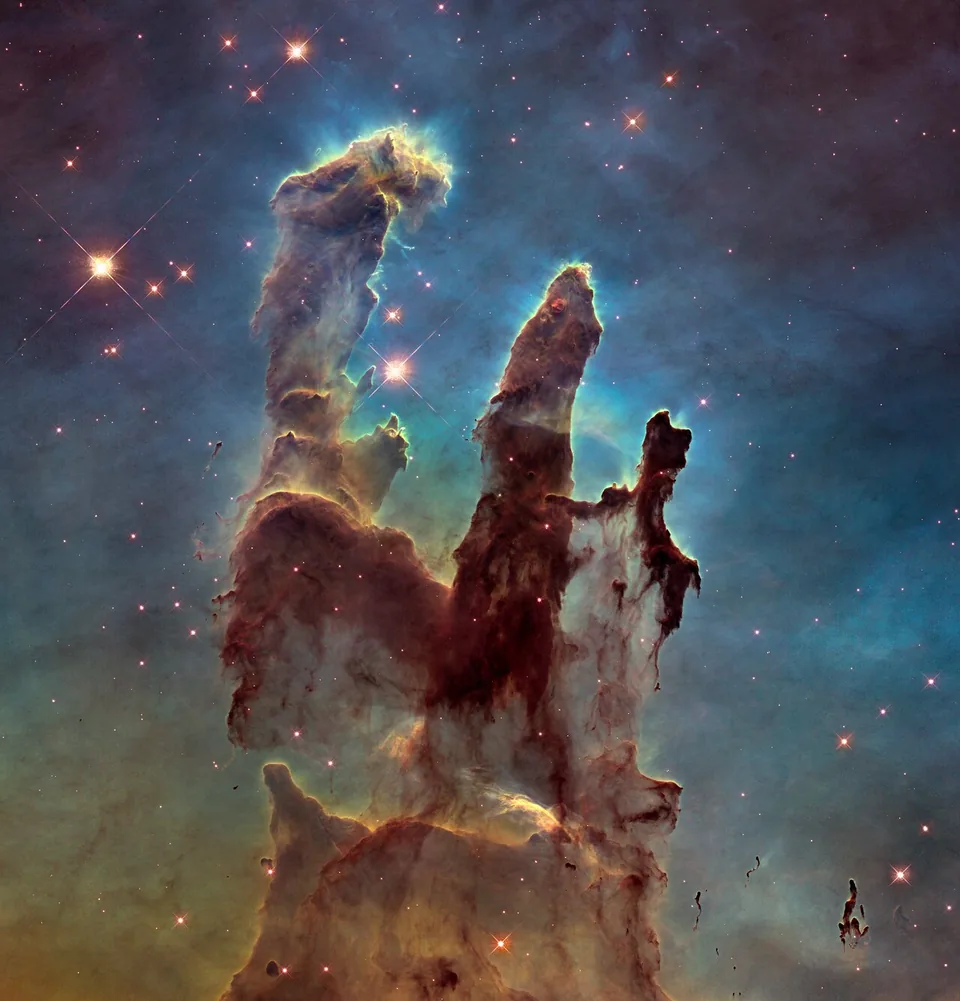
Dusty pillars in the Eagle Nebula, observed with Hubble. Blue, green and red display different narrow wavelength bands rather than the scene's eye colours.
Credit: NASA, ESA/Hubble and the Hubble Heritage Team. Image source · Reuse terms
About this observation
Hubble WFC3, September 2014; narrow-band F502N, F657N and F673N observations; released 5 January 2015. Assigned display colours: F502N [O III] blue; F657N H-alpha+[N II] green; F673N [S II] red. The colours distinguish measured emission-line bands.
Resized for this page; displayed images retain the source's colors and full frame. These images do not share a common physical scale.
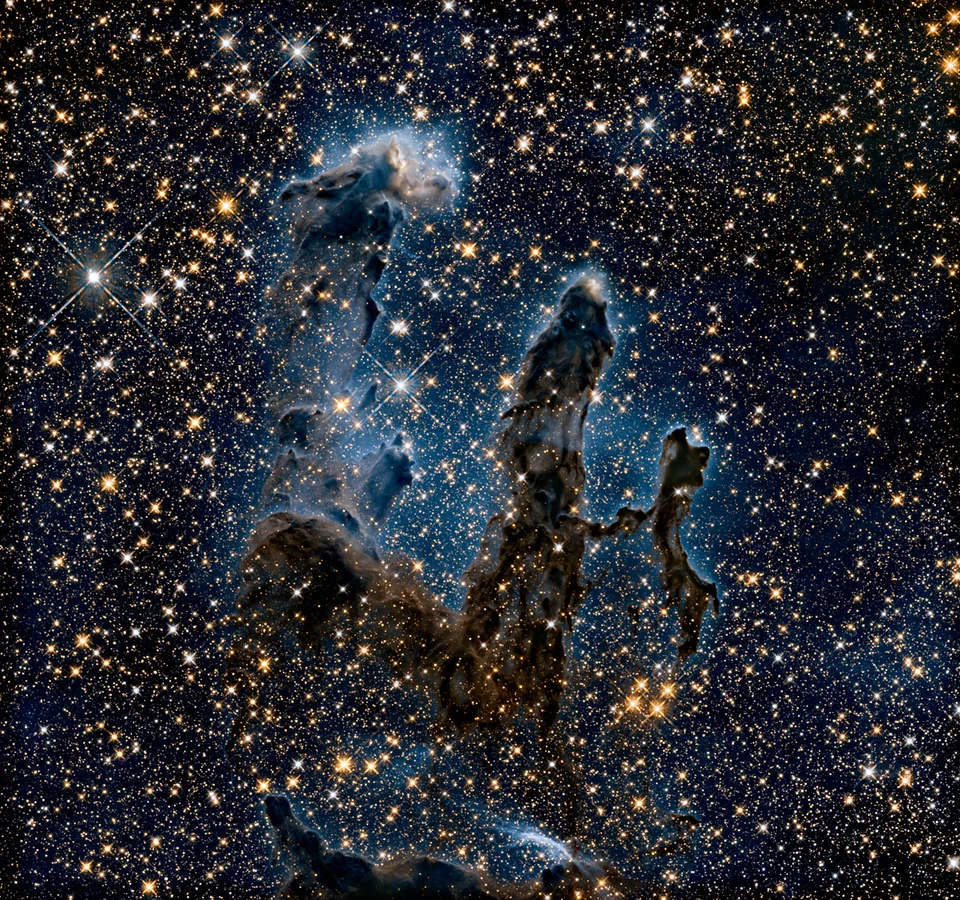
Near-infrared Hubble measurements reveal many stars behind the dusty pillars. Blue and yellow are assigned to two infrared bands.
Credit: NASA, ESA/Hubble and the Hubble Heritage Team. Image source · Reuse terms
About this observation
Hubble WFC3 infrared, September 2014; F110W (about 1.1 micrometres) and F160W (about 1.6 micrometres). F110W assigned blue; F160W yellow. Invisible infrared displayed in visible colours, not a natural-colour photograph.
Resized for this page; displayed images retain the source's colors and full frame. These images do not share a common physical scale.
The near-infrared view reveals many stars obscured in visible light because dust blocks those longer wavelengths less strongly. Dense material can remain opaque. The extra visible points do not mean that all those stars formed between the two pictures. The measured wavelength, source framing and display mapping have changed. ESA/Hubble 2015, “New View of the Pillars of Creation—Infrared,” image description
The visible-light composite combines these Wide Field Camera 3 exposures:
| Filter | Spectral features sampled | Assigned display colour |
|---|---|---|
| F502N | Emission from doubly ionized oxygen, [O III] | Blue |
| F657N | Hydrogen Hα and singly ionized nitrogen, [N II] | Green |
| F673N | Emission from singly ionized sulfur, [S II] | Red |
The filter identifiers name specific instrumental bands. Square brackets in these spectroscopic labels identify a class of atomic transitions; they are not editorial brackets. You do not need the atomic details to read the main result: green in this composite is an assigned representation of the F657N exposure. It is not a claim that the glowing gas would simply look green to your eyes.
The paired near-infrared view uses different filters and a different mapping: F110W is displayed in blue and F160W in yellow. Comparing the two images asks how appearance changes with observed wavelength, not how someone repainted one photograph. The source page identifies the filters, instrument, credit, orientation, and scale. NASA, ESA, and Hubble Heritage Team 2015, §§ Filters, Color Info, and Compass and Scale
Calibration and display answer different questions
Section titled “Calibration and display answer different questions”Before interpreting a signal, astronomers correct known instrumental effects. A detector can add an electronic offset, accumulate signal in darkness, or respond differently from pixel to pixel. Calibration uses reference measurements to estimate these effects. Comparing multiple exposures also helps identify cosmic-ray hits and other features that do not belong to the astronomical scene.
For example, Hubble’s Advanced Camera for Surveys pipeline distinguishes detector calibration from later geometric correction and image combination. These steps leave documented products and uncertainty information; “processed” does not mean that the data became imaginary. Lucas et al. 2026, ACS Data Handbook, § 3.2, “Pipeline Overview”
Preparing a display is a further decision. A scene can contain a very bright core and faint surrounding structure. A purely linear display may make the faint parts almost invisible. A nonlinear contrast stretch gives faint signals more display range while compressing bright ones. This can reveal structure, but it changes the relation between displayed brightness and measured signal.
Neither a stretch nor a colour assignment restores information lost to saturation or creates angular detail the instrument did not measure. For a quantitative claim, return to the calibrated measurements and their uncertainties. Measuring the brightness of a patch in a compressed web picture is generally not a substitute.
Four questions to ask a caption
Section titled “Four questions to ask a caption”Start with the instrument and wavelength bands: what was observed? Then read the colour assignment and processing: what does the display encode? Check the scale and orientation: does a mark mean an angle on the sky or a physical distance inferred from a distance estimate? Finally, identify whether the picture is an observation, a simulation, or an artist’s impression.
These questions do more than divide images into “real” and “fake.” A simulation can be valuable when its model is stated. An assigned-colour observation can faithfully reveal structure in invisible light. An artist’s impression can explain an interpretation, but it is not a direct measurement of the imagined scene.
The opening prediction is therefore answered by the wavelength key: infrared displayed as red does not say what an eye would see nearby. Our eyes cannot detect that infrared band. Likewise, red displayed in an astronomical image is not by itself a measurement of recession speed; that requires identified spectral shifts and an appropriate physical interpretation.
Show the math: a brighter display is not a brighter source
Let be a constructed, dimensionless relative signal, with a chosen maximum of 1000. A displayed level is black and is white. Compare two example mappings:
The logarithm acts on dimensionless numbers. The added one keeps zero signal finite, and the denominator makes the chosen maximum map to one.
| Relative signal | Linear display | Logarithmic display |
|---|---|---|
| 1 | 0.001 | 0.100 |
| 10 | 0.010 | 0.347 |
| 100 | 0.100 | 0.668 |
| 1000 | 1.000 | 1.000 |
The same signal of 10 is barely above black in the linear display but much brighter in the logarithmic display. Nothing in the source changed. This is an illustrative mapping, not a prescription for calibrating telescope data. The displayed level is also not a model of human brightness perception.
Try a missing caption
Section titled “Try a missing caption”Two images show the same nebula, one purple and one green. A post claims the nebula changed temperature between exposures. What information would you request before accepting the claim?
Answer
First compare dates, instruments, filters, colour assignments, and contrast stretches. If the pictures encode different wavelength bands or use different display mappings, their colours can differ without any physical change. A temperature claim needs a stated diagnostic, calibrated measurements, uncertainty estimates, and assumptions about the emitting material. The two display colours alone do not establish it.
For classrooms and clubs
Preparation: reading a table; no telescope required. Objective: distinguish a measured band from its displayed colour. In 15 minutes, give groups the same three values and different channel-assignment keys. Ask each group to write a caption that makes its interpretation recoverable without seeing colour; the table provides a nonvisual version. Changing the key changes the displayed hue without changing which detector band supplied each measurement.
For a longer extension, inspect the linked Hubble metadata. Learners should separate the observed filters and exposure information from choices such as the assigned blue, green, and red channels. Ask which information would be needed to compare physical brightnesses: calibrated measurements, rather than display colour alone. A common misconception is that an assigned colour makes the observation fabricated. The solved comparison shows why a stated mapping and retained measurements allow the representation to be interpreted.
Next, explore what a spectrum measures, or interpret a different kind of processed observation in the transit laboratory.
References
Section titled “References”- ESA/Hubble (2015). New View of the Pillars of Creation—Infrared. Image heic1501b, 5 January 2015. Near-infrared observation and interpretation.
- Lucas, Ray A., et al. ACS Data Handbook for Cycle 34, version 14.0. Baltimore: Space Telescope Science Institute, January 2026. § 3.2, “Pipeline Overview”.
- NASA Science. “Hubble FAQs.” NASA, n.d. § Hubble Observations. Accessed September 27, 2026.
- NASA, ESA, and the Hubble Heritage Team (STScI/AURA). “A View of the Pillars of Creation in Visible and in Near-Infrared Light.” January 5, 2015. Image, filters, colour mapping, and scale information.