What holds a galaxy together?
Scrollable formula. Use Left and Right arrow keys to reveal hidden content.
Scrollable table. Use Left and Right arrow keys to reveal additional columns.
Scrollable figure. Use Left and Right arrow keys to inspect hidden content.
https://blackhole.org/universe/galaxies/dark-matter/
A galaxy contains stars, gas, dust, and an enormous amount of space. Gravity organizes their motion. The puzzle is that the gravitational effects inferred from observations often exceed what the observed ordinary matter can explain under our standard gravity models.
Dark matter is the additional gravitating matter used to explain that mismatch and several other observations. The evidence concerns gravity; it has not yet identified what the dark matter is made of.
Motion measures more than a photograph
Section titled “Motion measures more than a photograph”A galaxy image shows where light reaches us from. A rotation curve adds another dimension: orbital speed as a function of distance from the center. Astronomers obtain motion information from shifts of spectral lines in stars or gas, then model the galaxy’s orientation to infer rotation.
The comparison requires care. A disk viewed nearly face-on has little rotation along our line of sight. Distance affects the conversion from angular positions to physical radii. Starlight must be converted into a stellar-mass estimate, and gas contributes mass too.
The SPARC research collection combines infrared photometry with rotation curves for 175 disk galaxies. Its mass models distinguish stellar and gas contributions rather than simply equating the brightest part of an image with all the mass (Lelli, McGaugh, and Schombert 2016, abstract). A real test uses the geometry and uncertainties for the particular galaxy.
A simple model makes a clear prediction
Section titled “A simple model makes a clear prediction”First imagine a spherical mass distribution with nearly all its mass inside ten kiloparsecs. A kiloparsec, abbreviated kpc, is one thousand parsecs, or about 3,260 light-years. Outside that region, circular orbital speed decreases with distance: farther-out orbits enclose essentially the same mass, while gravity weakens.
Set the speed at ten kpc to 200 kilometers per second. This simple model predicts 100 kilometers per second at forty kpc. The diagram compares that decline with a hypothetical flat curve that stays at 200 kilometers per second.
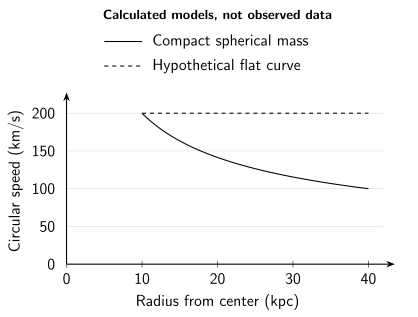
Two calculated comparisons, with no observed data points. The solid curve assumes circular Newtonian orbits outside a compact spherical mass distribution; the dashed curve is a hypothetical constant-speed comparison. This spherical example is not a calculation of a flattened stellar disk.
| Radius | Compact spherical mass model | Hypothetical flat comparison |
|---|---|---|
| 10 kpc | 200 km/s | 200 km/s |
| 20 kpc | About 141 km/s | 200 km/s |
| 40 kpc | 100 km/s | 200 km/s |
Many measured outer-galaxy curves remain higher than a model of the luminous matter alone predicts. A broad dark-matter halo adds gravitating mass beyond much of the starlight. However, real curves are not all perfectly flat, and the spherical shortcut above cannot replace the gravity calculation for an actual disk.
Try the mathematics: enclosed mass
Preparation: algebra, squares, and inverse square roots.
For a circular orbit in a spherical Newtonian mass distribution, gravity supplies the acceleration needed to turn:
means the mass enclosed within radius . If that mass stops increasing, decreases as . At four times the radius, speed is half as large.
If speed instead stays constant, the inferred enclosed mass must grow in proportion to radius. Four times the radius then requires four times the enclosed mass. This is a spherical-equivalent inference; a flattened disk has a different gravitational geometry.
Check gravity in another way
Section titled “Check gravity in another way”Gravity also bends light. Gravitational lensing changes the apparent shapes and positions of background objects. Modeling those distortions provides a way to study foreground mass that does not depend on measuring stars’ orbital speeds. Galaxy clusters show substantial mass beyond the luminous stellar component, with the hot gas included in the ordinary-matter accounting (NASA, “Studying Dark Matter”).
The lensing explanation shows how redirected light can produce multiple images and constrain a foreground mass. Lensing maps remain inferences from data and a gravity model. They are not photographs of a new particle. Cosmological measurements and the growth of structure provide additional tests; a successful explanation must work across those different scales.
A central black hole cannot by itself supply an extended halo. Well outside a compact central mass, the simple declining-speed argument applies again. Nor is dark matter the same as dark energy, which concerns the large-scale expansion history.
Predict what a flat curve requires
Section titled “Predict what a flat curve requires”Under our spherical model, suppose the speed is unchanged between twenty and sixty kpc. How much enclosed mass is needed at the larger radius? Would that answer identify a particular dark-matter particle?
Answer and transfer
Three times as much enclosed mass is required, because and the radius has tripled.
This tells us what gravitating mass the model requires. It does not reveal a particle’s mass, charge, or interactions. It also does not, by itself, rule out every proposed modification of gravity. Those proposals must be checked against rotation curves, lensing, cosmology, and other observations together.
If the speed fell by a factor of two while radius grew by four, the same equation would instead give unchanged enclosed mass. The direction of the change matters as much as the word “fast.”
For educators
Preparation and objective. The main comparison needs ratios; the optional derivation uses algebra and square roots. Students should explain how motion constrains gravitating mass without identifying a dark-matter particle.
Short activity, about 10 minutes. Mark the figure “model comparison” and compare the speeds at 10 and 40 kpc. Expected answer: constant enclosed spherical mass gives half the speed at four times the radius; the hypothetical flat curve does not.
Longer extension, about 30 minutes. Separate measured quantities, assumed geometry, and inferred mass in three columns. Calculate the enclosed-mass ratio at 20 and 60 kpc for unchanged speed, then compare this dynamical inference with lensing. Expected answer: three times the mass in the spherical model; lensing uses distorted light rather than orbital speed. The table permits an offline version.
Misconception to discuss. “The central black hole explains a flat outer rotation curve.” A compact central mass gives the declining-speed limit outside it. Require students to state the spherical approximation and explain why a real disk requires its own gravity calculation.
References
Section titled “References”- Lelli, F., McGaugh, S. S., and Schombert, J. M. (2016). “SPARC: Mass Models for 175 Disk Galaxies with Spitzer Photometry and Accurate Rotation Curves.” The Astronomical Journal 152, 157. DOI; open manuscript.
- NASA. Dark Matter, especially “Studying Dark Matter.” NASA Science. Overview.
Further reading
Section titled “Further reading”For an optional treatment of the data, uncertainties, and competing gravity models, read Galaxy Rotation Curves and Acceleration Relations. Preparation: Newtonian gravity, calculus, and statistical inference.