Why are some stars bright but cool?
Scrollable formula. Use Left and Right arrow keys to reveal hidden content.
Scrollable table. Use Left and Right arrow keys to reveal additional columns.
Scrollable figure. Use Left and Right arrow keys to inspect hidden content.
https://blackhole.org/universe/stars/hr-diagram/
A small, very hot star can emit less light than a large, cooler one. Temperature tells us about the power leaving each patch of a star’s surface. Size tells us how many such patches there are. Put the two together and the apparent contradiction disappears.
The Hertzsprung–Russell diagram, usually shortened to H–R diagram, brings temperature and luminosity onto one map. It helps us compare stars and recognize patterns that a photograph of the sky would hide.
Temperature and size share the work
Section titled “Temperature and size share the work”Luminosity is the total power a star radiates. It is different from the amount of light reaching a telescope: a luminous star can look faint because it is far away. Dust can also absorb and scatter its light. To estimate luminosity, astronomers need distance and a way to account for light outside their instrument’s wavelength range.
For a spherical star, surface area grows as the square of radius. Double the radius, and there is four times as much radiating area. The total power leaving each unit of area grows as the fourth power of the star’s effective temperature. Doubling that temperature gives sixteen times the power per unit area.
Effective temperature is the temperature an ideal thermal emitter would need to produce the same total power per unit area. Real stellar spectra contain absorption lines and other departures from that ideal. The definition does not claim that every star is a perfect blackbody.
Imagine a star with half the Sun’s effective temperature but twenty times its radius. Each patch emits one-sixteenth as much power; the surface has four hundred times the area. Together those changes give twenty-five times the Sun’s luminosity. The larger surface more than compensates for the cooler temperature.
Read the axes before the pattern
Section titled “Read the axes before the pattern”On the diagram below, luminosity increases upward. Temperature increases to the left, following the astronomical convention. The vertical scale is logarithmic: equal steps represent equal multiplying factors, rather than equal additions. The plotted objects are constructed comparisons, not measured named stars.
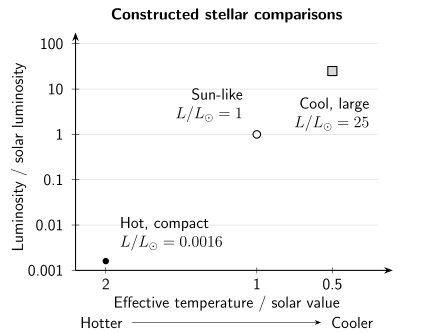
Temperature alone does not determine luminosity. These three calculated examples use the same luminosity–radius–temperature relation; the temperature axis runs from hotter to cooler, and luminosity is logarithmic. The points are neither observations nor an evolutionary track.
| Constructed comparison | Temperature relative to Sun | Radius relative to Sun | Luminosity relative to Sun |
|---|---|---|---|
| Hot, compact | 2 | 0.01 | 0.0016 |
| Sun-like | 1 | 1 | 1 |
| Cool, large | 0.5 | 20 | 25 |
Real stellar populations form recognizable regions. Stars fusing hydrogen in their cores occupy the main sequence. Giants can be cool and luminous; white dwarfs can be hot and faint because their radiating surfaces are small. The Gaia mission reveals these patterns using stellar distances and measurements in different wavelength bands. Its observed color–absolute-magnitude diagram has related, but different, axes from our temperature–total-luminosity comparison (ESA/Gaia 2018, diagram explanation).
A point tells you about properties, not where a star sits in space. Nor does joining arbitrary points show the life of one star. An evolutionary track needs a physical calculation of how a star changes. The luminosity relation describes the radiating surface; nuclear reactions and energy transport explain how a main-sequence star supplies that output. Explore changing interiors in stellar lives and remnants.
Try the mathematics: two powers and four powers
Write radius as , effective temperature as , and luminosity as . The Stefan–Boltzmann relation is
Here is the Stefan–Boltzmann constant, and the Sun symbol means the corresponding solar value. The second relation comes from dividing the first equation by its solar counterpart: the common constants cancel.
For the cool, large example, . For the hot, compact example, . These calculations establish internally consistent radiating surfaces. They do not establish that every freely chosen pair of radius and temperature is a stable star.
Predict what a telescope receives
Section titled “Predict what a telescope receives”Two unobscured stars have equal luminosity. One is twice as far away. Predict whether it delivers the same amount of light, half as much, or one-quarter as much to the same telescope.
Answer and a new comparison
It delivers one-quarter as much. The light spreads over a sphere whose area grows with distance squared. Thus received power per unit area, called flux, is at distance .
Now compare our cool, large example with the Sun-like example at the same distance: it delivers twenty-five times the flux. Move it five times farther away and the extra spreading cancels the luminosity advantage. Their fluxes are then equal, although their temperatures and luminosities remain different. This is why an apparent-brightness ranking cannot replace an H–R diagram.
In the H–R diagram lab, predict a change before moving a control. Hold radius fixed while changing temperature; then hold temperature fixed while changing radius. Explain which quantity the control changes and which quantity the model calculates.
For educators
Prepare the three constructed examples as cards or a printed table. The objective is to explain luminosity using both surface temperature and surface area, then distinguish luminosity from apparent brightness. No astronomy background is needed; multiplication and powers support the optional numerical comparisons.
For a 5–10 minute activity, sort the cards by temperature and luminosity. Expected reasoning places the cool, large example above the hotter compact one in luminosity because area also matters. Ask students to label the temperature arrow explicitly: it points left. Address the misconception that the diagram is a map of positions in space.
For a 20-minute investigation, hold one quantity fixed while changing the other, using the paper table or the linked lab. Doubling radius should give four times the luminosity; doubling temperature should give sixteen times. Then put the cool, large example five times farther away than the Sun-like one. Successful reasoning predicts equal flux despite unequal luminosities, and does not join the cards into one star’s evolutionary track.
References
Section titled “References”- ESA/Gaia/DPAC (2018). Gaia’s Hertzsprung–Russell diagram. European Space Agency, 25 April 2018. Diagram explanation.